Analytical Comparisons Between the AI Boom and the Dot-Com Bubble
16/09/2025
This report was written as the final coursework a subject I took last semester - Digital Tools and Methods It was an incredibly well-taught subject thanks to its lecturer Dr Falk and I highly recommend it to Computer Science students in need of a breadth. While I would not call it an easy subject especially if you are not used to more open-ended assignments, I enjoyed it thoroughly and scored well in the end. Although I am neither a competent or persuasive writer, I am proud of my writing and as such would like to post it.
Introduction
In 2022, the public release of OpenAI’s LLM ChatGPT sparked the beginning of the mass adoption of LLMs in consumer software. The result since then has been an “AI Spring”
This rapid boom of progress and excitement about the possibilities of LLMs has led skeptics to draw comparisons to the dot-com bubble. On initial inspection, both the dot-com and AI eras are characterised by an abundance of enthusiasm towards a developing technology, whether it is the world-wide-web or generative AI, with many speculating on this new technology in hopes of achieving wealth. I’ve seen this sentiment online enough to begin considering whether those similarities have weight. This essay aims to make analytical comparisons between the financial patterns during both the dot-com and generative AI era in order to answer that question. I will come up with a formal definition for what makes an economic bubble and attempt to identify those characteristics in financial data-relating to the dot-com era - a known financial bubble.
Afterwards I will move onto looking at the data for those same dot-com companies in the AI era. Should I find those same traits to be found in abundance, we can then begin to identify empirical evidence of potential signs of a bubble. After analysing both eras, I will attempt to form my own opinion and prediction on whether this Spring will bloom further or wilt.
Defining a Bubble
Before we can even begin looking into the data, we must first define the metric for what a “bubble” even means.
Fortunately, it seems that the economist John Kenneth Galbraith has taken this subject and has written his own non-digital report on the topic. Galbraith published a book in 1993 titled “A Short History of Financial Euphoria”, detailing the properties and signs of an economic bubble. Through his writings, Galbraith highlights the following features of an economic bubble. A prominent indicator is the rapid escalation of prices that far outweigh the inherent value of the resource. Galbraith points towards the rapid over-evaluation of Tulip flowers in Amsterdam, aptly named Tulipomania. At the height of this mania in 1636, one could pay “a new carriage, two grey horses and a complete harness” (Galbraith 1993) for the privilege of owning a tulip bulb that, years prior, had little to no worth.
From there we can split our metric into two components:
- The value of a resource must be increasing - ideally at a rapid rate.
- The perceived value of said resource should exceed its inherent value.
While determining whether a resource is overvalued is more of an interpretive question, I can easily visualise the rise in value via time-series plots. A sharp increase in value coupled with the object’s objective value being far less are the signs I’ll be looking for. If I can find those patterns in a both known-crash such as the Dot-Com Bubble and the current trends for the AI era, we can start making inferences about whether AI is doomed to a similar fate.
Data Collection and Preprocessing
My dataset of choice was a CSV file containing financial ticker information spanning the years 1962 to 2024. With over 9000 tickers, our dataset is ~3GiB in size - far too large to reasonably work with on the Jupyter server. In addition, I only needed a minute subset of the data to analyse.
I segmented the CSV file into 2 partitions representing financial information from the years of the dot-com (1995-2002) and AI (2021 - 2024) eras respectively. While collating data from those years, I also filtered specific companies that were prominent during both the dot-com and AI era. Unfortunately legacy stocks such as those for Yahoo or many of the failed companies that defined the dot-com era such as Pets.com or Webvan are not easily accessible, prominent companies such as Amazon and CISCO are featured in the dataset.
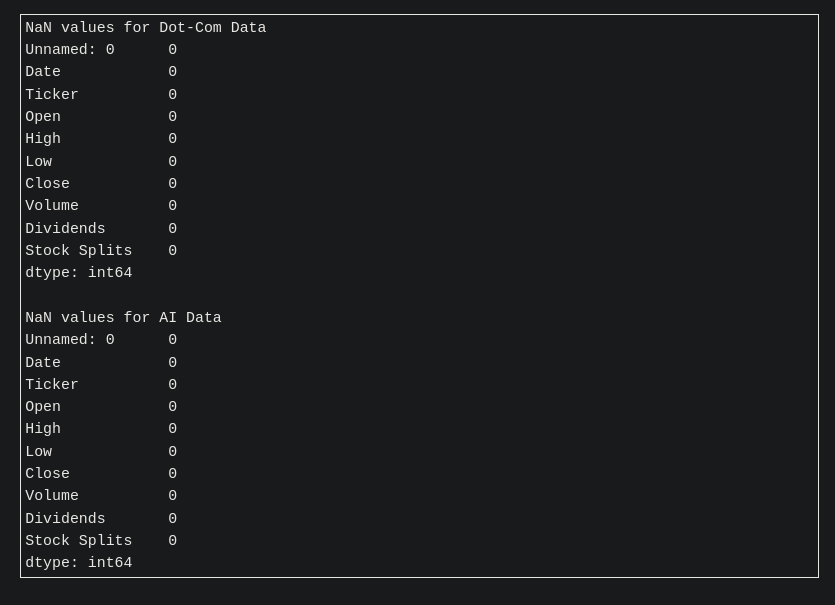
Splitting the dataset in this manner made tasks much faster with the file size being reduced from 3GiB to ~1MiB and 650KiB for the two datasets. With our new datasets we can start our analysis of the data. Due to both the data being sourced from Kaggle and my own checks on the data, there do not appear to be any missing or erroneous values meaning we do not need to perform any extra preprocessing. There was also no need to remove any outlier values for any columns. Given that the dot-com bubble was defined by greatly inflated prices and high over-evaluation, values in the year 2000 will likely be identified as outliers as that marked the peak of the bubble.
With little trouble, our dataset has been segmented and prepared for visualisation and analysis.
Company Selection
I aimed to select companies that were present in both datasets. While some companies may not use generative AI, I aimed to select companies that have outright shown to have introduced LLMs into their systems. This was accomplished via a simple intersection operation.
However, these tickers proved to be quite difficult to interpret so I used the Yahoo Finance python library to convert them into more human-readable names. From there I selected a collection of prominent tech companies to form my list.
- CISCO
- Amazon
- Ebay
- IBM
- Microsoft
- NVIDIA
import yfinance as yf
import requests
import time

# assume segmentA and segmentB are the partitioned dataframes
companiesA = segmentA["Ticker"].unique()
companiesB = segmentB["Ticker"].unique()

tickers= list(set(companiesA).intersection(companiesB))

data = yf.Ticker("AMZN")
print(data.info["displayName"])
companyCount = len(tickers)
print(companyCount)
with open("companies.txt", 'w') as f:
  currentCompany = 1
  attempts = 1
  while currentCompany <= companyCount:
      if attempts >= 3:
          currentCompany += 1
          attempts = 1
          continue
      try:
          ticker = tickers[currentCompany - 1]
          print(ticker)
          data = yf.Ticker(ticker)
          name = data.info["displayName"]
          print(name)
          f.write(f"{name}\n")
          currentCompany += 1
          attempts = 1
      except:
          # exponential backoff because sometimes the library fails
          time.sleep(2**attempts)
          attempts += 1
          continue
Creating Plots
With my companies selected, I moved onto creating the actual plots, I created time series graphs to visualize the trend of the stock prices. My initial approach was to plot all the data points against the months. However the result, while technically more informative due to more data, yielded jagged lines and difficult to interpret plots. This does not align with Tufte’s principles of visualizations being as clear as the thought process that created them (Tufte 1997). In this case, less is more so I aggregated the data based on the months between their respective years and took the average closing price for each company.
For ease of use I defined a function to repeat this process for the companies.
def plot_company(df, ticker, name):
df["Date"] = pd.to_datetime(df["Date"])
df["Month"] = pd.DatetimeIndex(df["Date"]).to_period("M").to_timestamp(how="end")
company = df[df["Ticker"] == ticker].copy()
# aggregate based on months and get the average closing price
monthlyAverage = company.groupby("Month")["Close"].mean().reset_index()
return (
so.Plot(monthlyAverage, x="Month", y="Close")
.add(so.Line())
.label(title=f"Monthly Average Closing Value for {name}", x="Year", y="Close Price")
)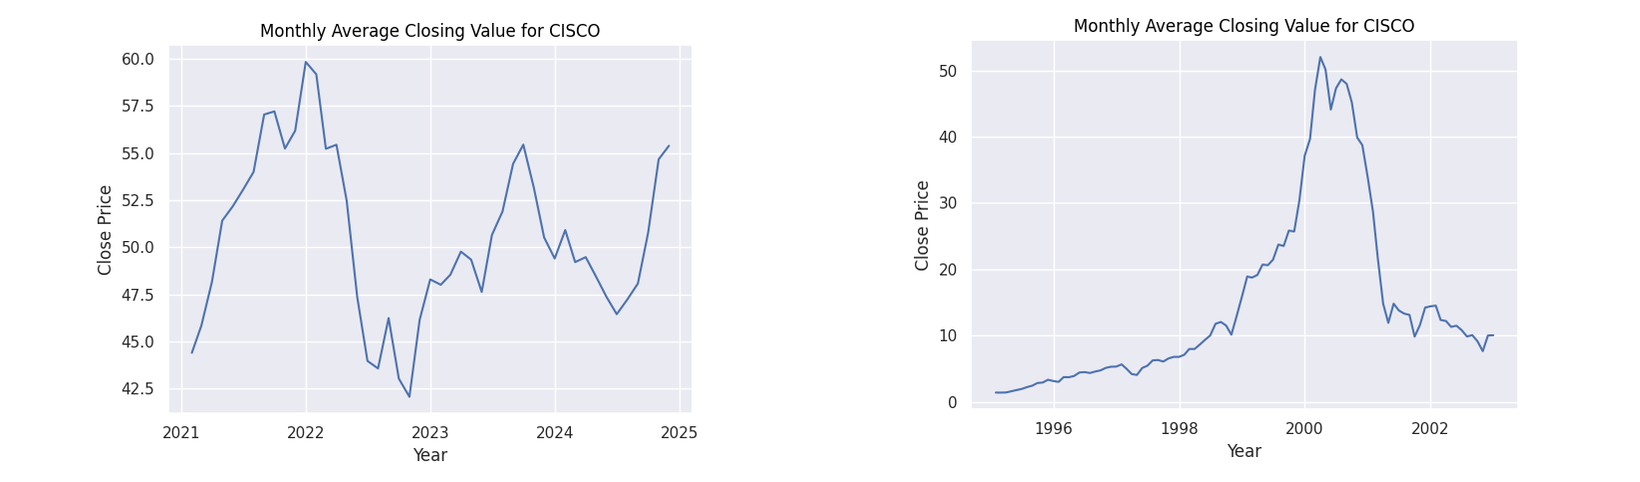 Figure 1: Monthly average closing values for CISCO
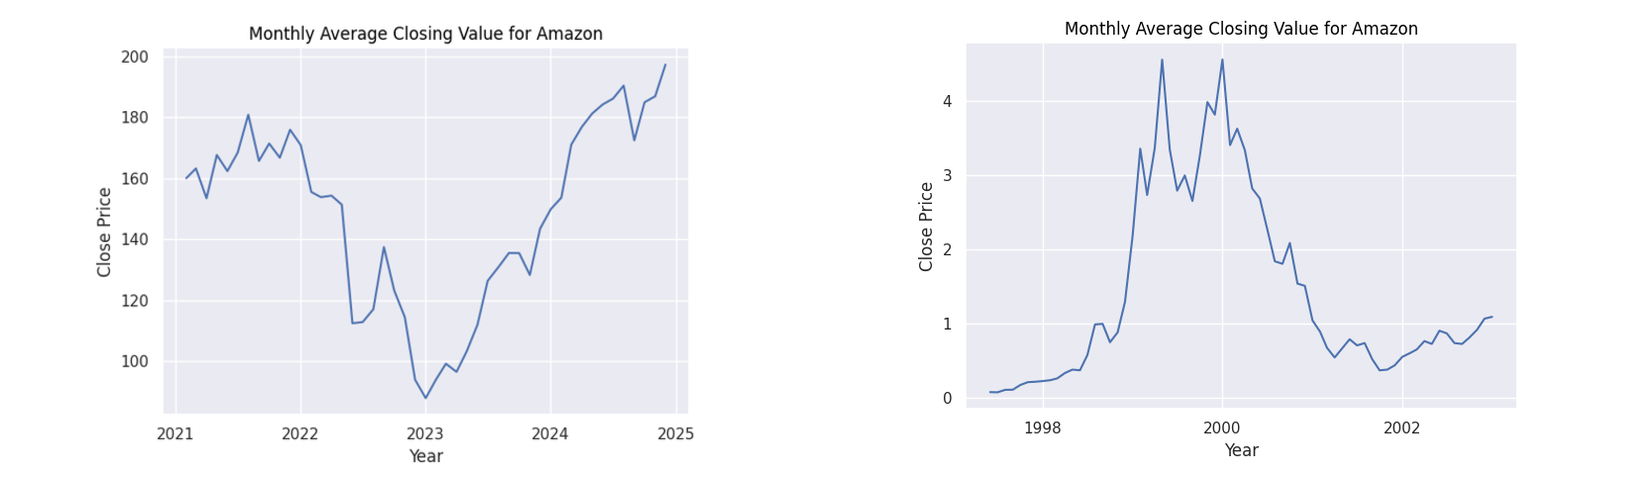 Figure 2: Monthly average closing values for Amazon
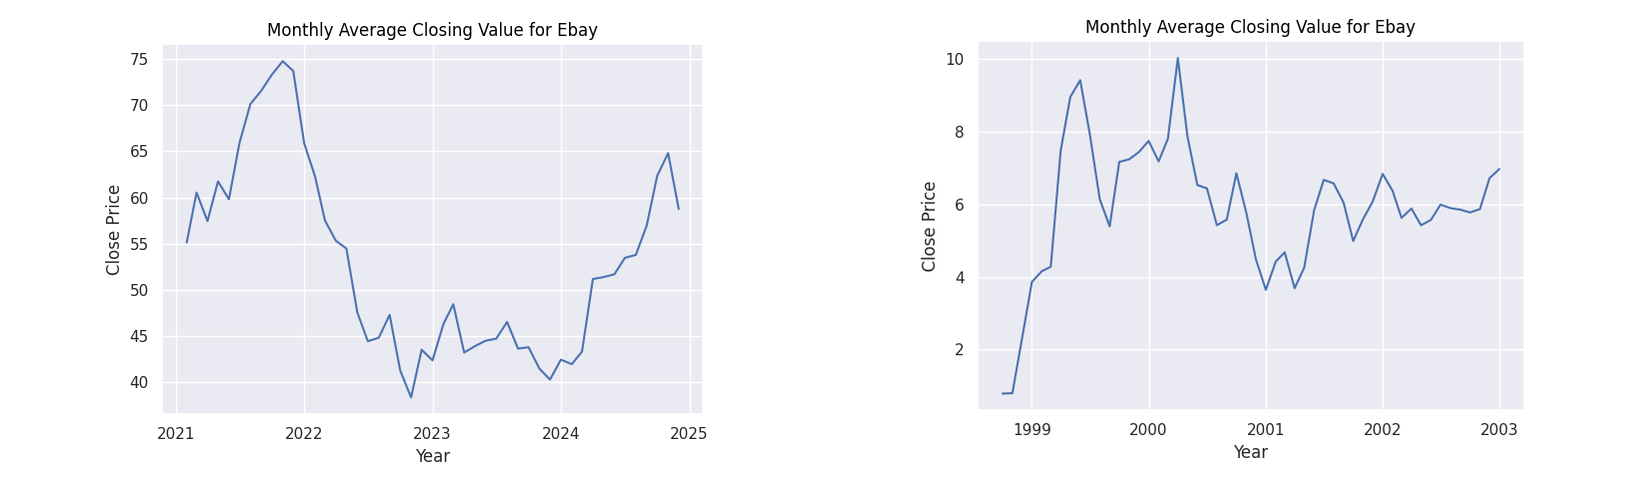 Figure 3: Monthly average closing values for Ebay
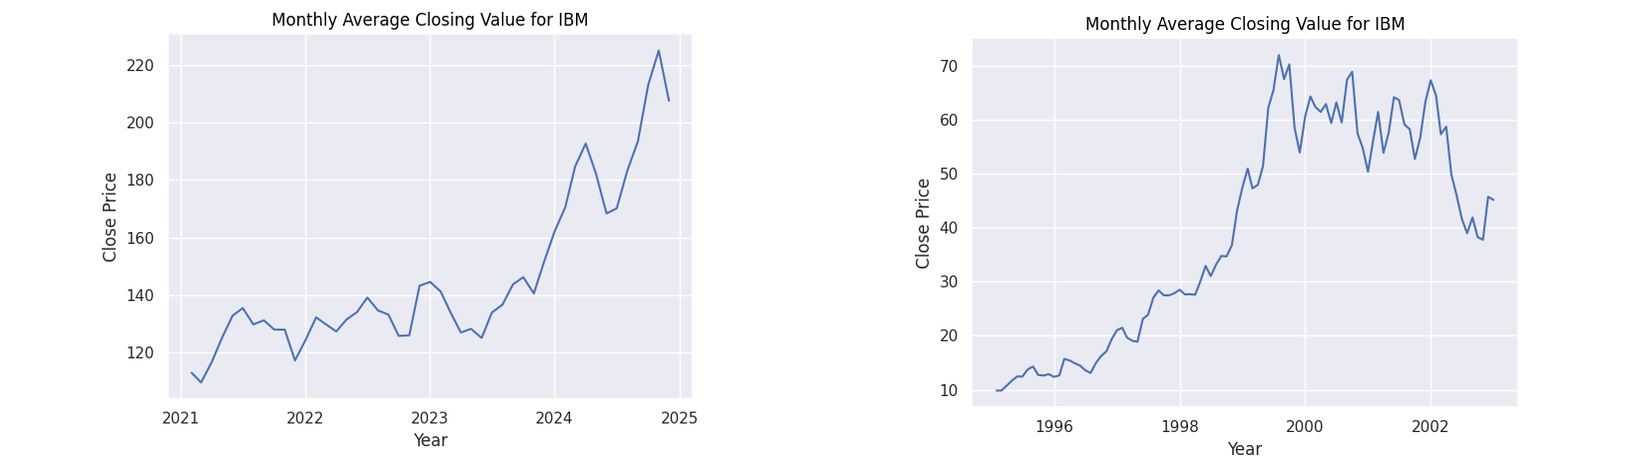 Figure 4: Monthly average closing values for IBM
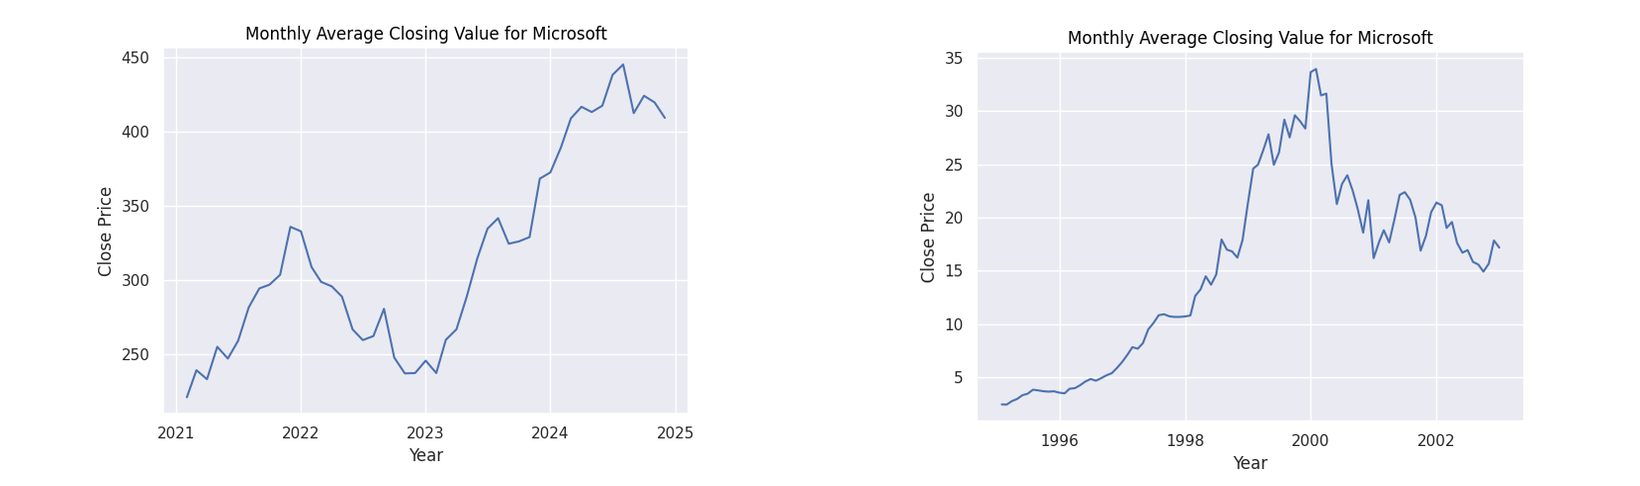 Figure 5: Monthly average closing values for Microsoft
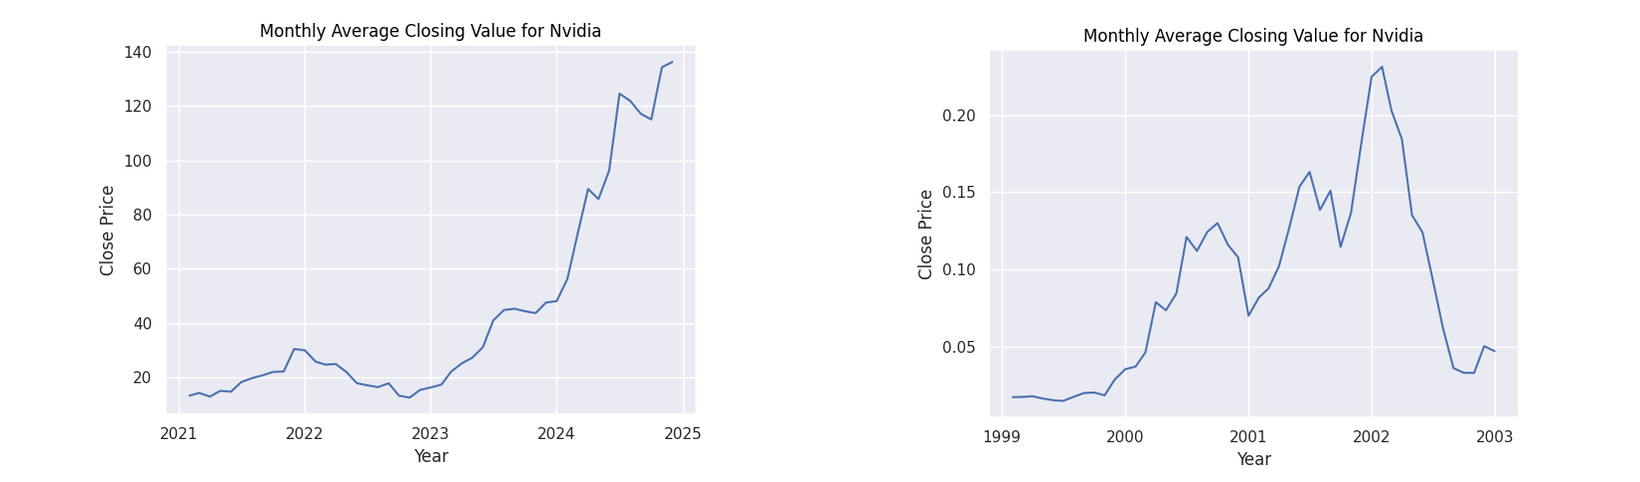 Figure 6: Monthly average closing values for NVIDIA
Interpretations
Observing the general patterns in the dot-com figures, there is a clear period of dramatic growth starting from around 1999 to 2000 showing the height of the speculation. What follows is a dramatic collapse as the bubble burst. While our AI figures do not show this explicit pattern as we are yet to witness the burst of this theoretical bubble, we do see a common pattern of a dip when approaching the year 2023 followed by a steady growth. Many factors may have caused this decline. However, given the common thread of all these companies being based on technology, a strong contributor could have been the collapse of the Silicon Valley Bank in 2023.
The point of interest I will focus on however is the following rise. In all of the companies we can see a steady increase afterwards. A reason for this increase could be due to the increased optimism in generative AI with companies such as Amazon, Microsoft and NVIDIA putting vast sums of money into the technology (Amazon 2023). This behaviour can be seen with their financial patterns as they display the greatest rate of increase from 2023. It can be seen that all stocks for these companies have a positive trajectory fulfilling the first axiom for an economic bubble.
Recall that Galbraith’s definition of a bubble was composed of two components:
- A sharp increase in value (see the exorbitant prices for tulips)
- The Inherent value of the resource far below its perceived value (again, see the tulips)
Following his definition, we have the sharp rise in price now we just need to answer the second question; are companies overstating the value of generative AI?
The Inherent Value of Generative AI
While this may be seen as a tangent to the main argument, it is an important sub-question to ask as that answer will help determine the likelihood of generative AI being a bubble. Looking at the technology through a business lens, generative AI is a potentially cheaper alternative to tasks that would require low levels of reasoning and thinking such as copywriting, building simple software applications or labelling data. While this is definitely far from our incredibly nuanced definition of intelligence, its “intelligence” is enough to generate business value for a company meaning that in their eyes, generative AI is “intelligent enough”.
Many have pointed out the potential utility that such AI can provide to the economy. Resources such as Goldman Sachs have estimated a potential 7% rise in the global GDP (Goldman 2023) by implementing the technology. In his book Human Compatible, Stuart Russell argues the advent of intelligent AI as one of the “biggest event(s) in the future of humanity” comparing it to a visit from a species of higher intelligence (Russell 2020). Russell describes the potential for such an AI, a general purpose AI, as an “Everything as a Service” or “EaaS”. While we are far from the robotic helpers of science fiction, companies are seeing the potential in low-level robotic employees and are allocating funds accordingly as evidenced by Big Tech’s increased spending in the technology.
However while generative AI can provide monetary value in businesses in the future, the current state of the technology may be considered overvalued. The cost of their use has been shown to be unprofitable with OpenAI, one of the biggest providers of this service, losing $5 billion in 2024 (Lesswrong 2025). Furthermore, the desire to integrate generative AI with private company data would require either the use of fine-tuning or the construction of a Retrieval-Augmented-Generation (RAG) system, both of which require both technical knowledge and additional cost.
Russell also mentions in his book that many “breakthroughs” are simply the product of the “gradual accumulation of ideas and evidence of their validity crossing a threshold” leading to media reporting a “breakthrough”. He gives the example of Deep Blue’s chess victory as while impressive, AI’s ability to surpass humans in specific tasks was already known by researchers (Russell 2020).
Extending his thoughts on deep-learning to generative AI, while impressive at a surface level, only indicates that generative AI’s technology has become viable as a tool - it has only barely crossed that threshold. However companies are treating the technology as mature and placing heavy amounts of faith into its potential. From there, those same attitudes towards the internet that caused the dot-com bubble begin to form.
In other words, I do believe that companies are placing too much faith into the potential for generative AI to boost their productivity. It is overvalued.
Conclusion
At this point in time, I neither possess the crystal ball or economics degree required to make a high confidence prediction for the outcome of this AI Spring. With that being said however, I do believe that both the dot-com bubble and AI Spring do possess similarities.
Both eras began with a product that drove attention towards new potential. For dot-com this was the Mosaic and Netscape web browser that made the internet accessible. In the AI era, this would be the attention being put into LLMs by various companies along with the crash of the Silicon Valley Bank providing incentive to invest in AIs. The technology in both, while relatively new, had many blindly trusting its potential, further driving up the bubble. Our figures show relatively similar shapes indicating the sentiment towards LLMs mirror that of the dot-com era’s early internet.
In the end, while I would argue a minor crash could potentially happen the more monolithic nature of technology companies today would mean that the burst will cause less of a dent. Some AI startups may be wiped out just like the Pets.com and Webvan of the dot-com era however in the long run, the infrastructure and maturing of LLMs will eventually lead to a point where these robotic workers are viable. Whether this theoretical future resembles a utopia or dystopia is up for interpretation.
References
Amazon. 2023. “Amazon to Put ’More Dollars’ Towards Generative AI, CFO Says.”
Galbraith, John Kenneth. 1993. A Short History of Financial Euphoria. New York, NY: Whittle Books in association with Viking.
Goldman, Sachs. 2023. “Generative AI Could Raise Global GDP by 7.”
Russell, Stuart J. 2020. Human Compatible: Artificial Intelligence and the Problem of Control. London, United Kingdom: Penguin Books.
Tufte, Edward R. 1997. Visual Explanations: Images and Quantities, Evidence and Narrative. Cheshire, Conn: Graphics Press.